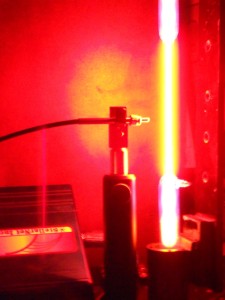
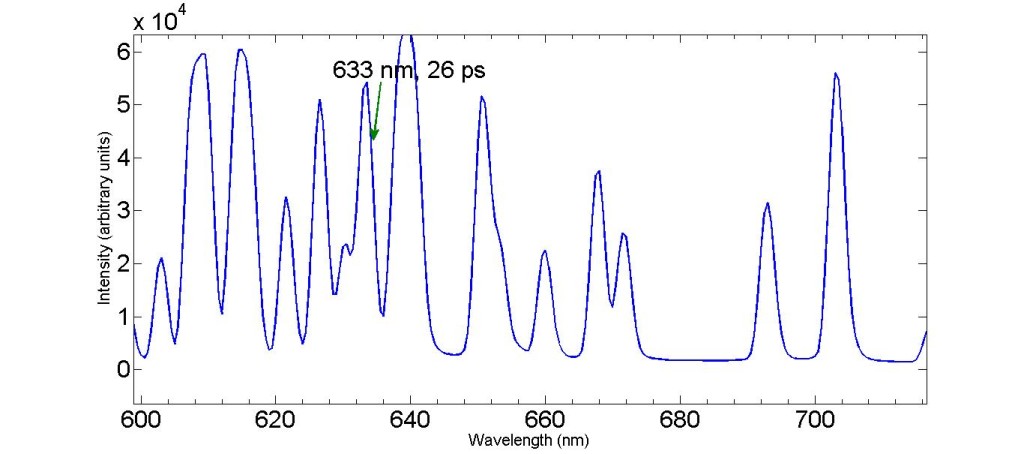
A neon lamp is placed inside a spectral tube holder and the emission spectrum is observed with a fiber optics spectrometer. The spectrum is loaded into a data analysis software. Some peaks are chosen, notably the 633 nm transition seen in HeNe lasers. The linewidths are determined and the lifetime of the excited states are estimated. This is a nice straightforward demonstration of the energy-time uncertainty relationship, generally difficult to understand.
