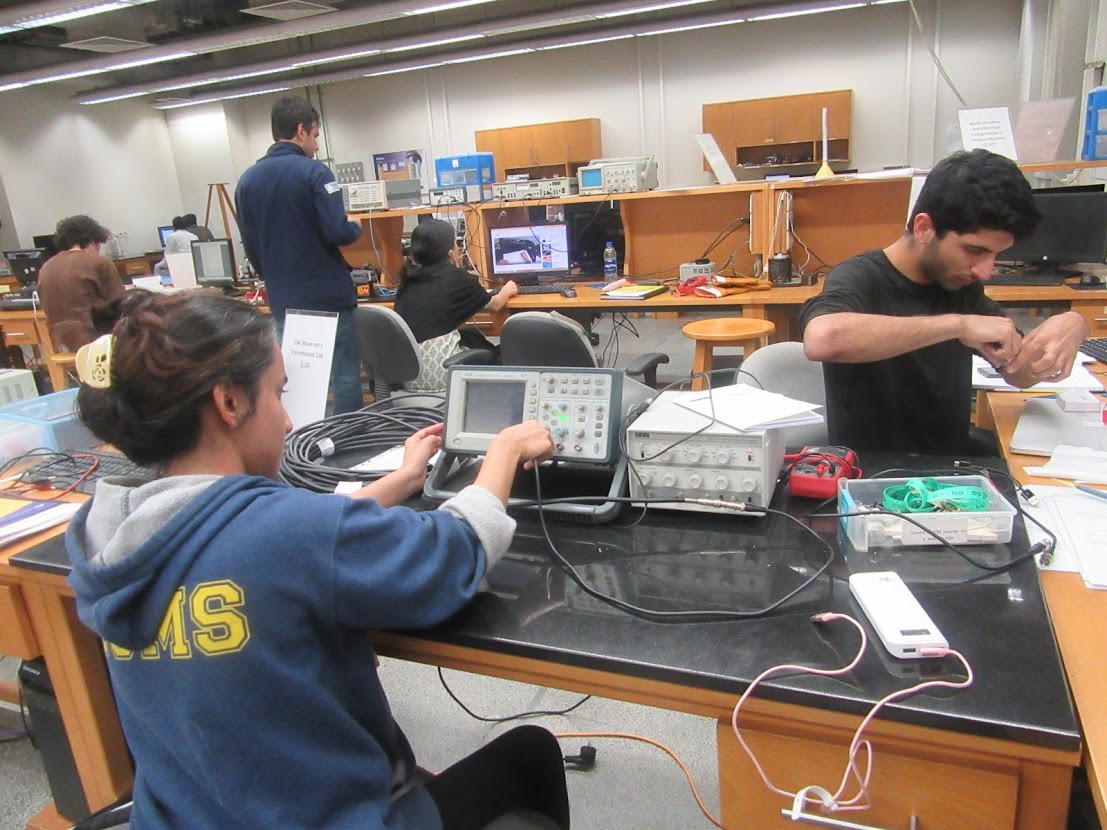
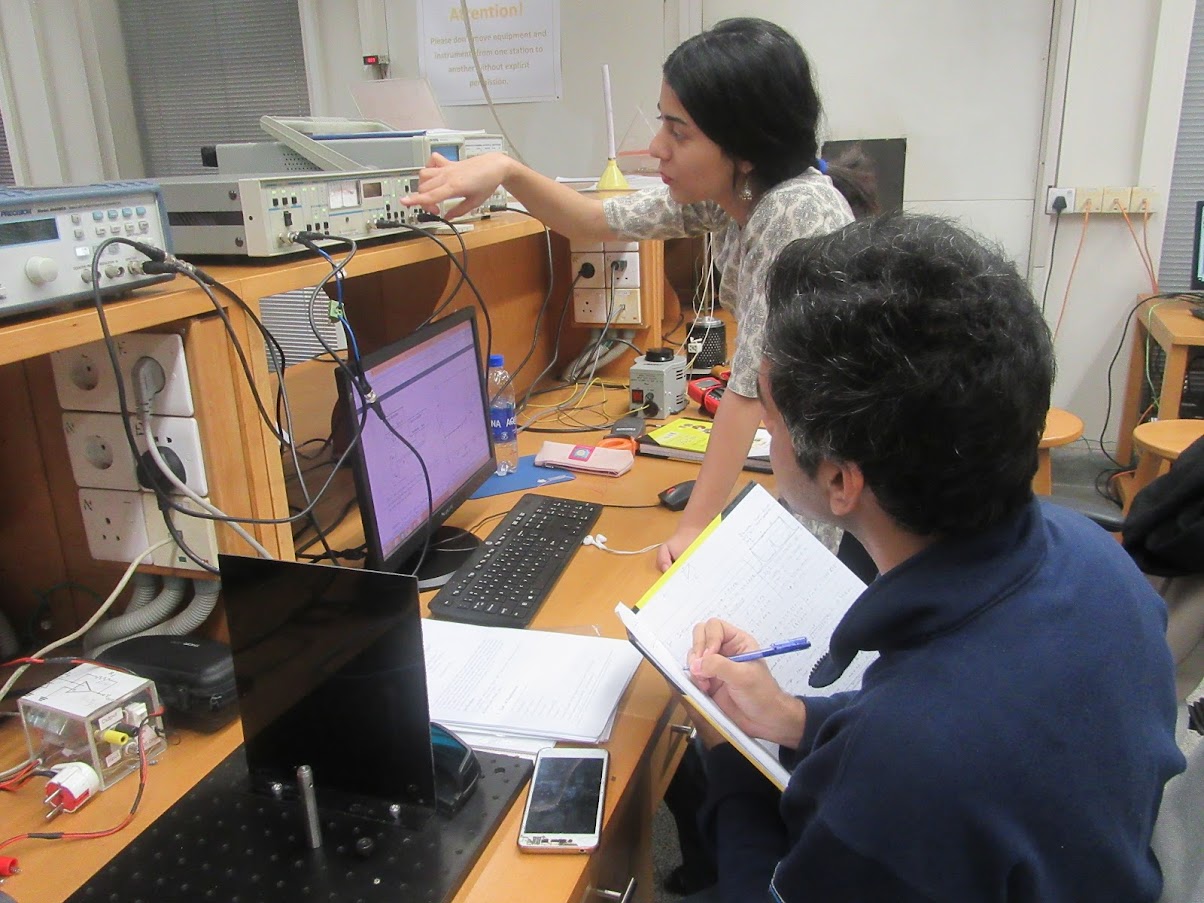
This is our advanced physics laboratory that offers state-of-the-art experimental training in specialist experiments to our advanced undergrads and graduate students. There is more project work, troubleshooting, experimental design and lots of open-ended inquiries. The course also comprises components of scientific writing, presentation, computation, workshop practice and innovation.
Logistics and outline
-
- Homeworks and preparatory activities: 25%
- Experimental work: 50%
- Reports and presentation of work: 25%
- Grading mental picture
Homeworks
- HW 1 is due on 25 September and deals with plotting, uncertainties
- HW 2 is due on 2 October and its subject is probability distributions and inferring statistics thereform
- Finally here is HW 3 that is due on 10 October.


Software Skills
- Presentation on scientific computing with Matlab (2025).
- Presentation on scientific computing with Python (2025).
- Link to our tutorials on Python, with examples from astronomy, uploaded on our Astrolab page.
- Please also see the link for Python programming in the “Software Carpentry” page.
- A Jupyter notebook can be found here that we used in class to talk about types of uncertainties, meaning of standard deviation and its difference from standard error, followed by confidence intervals.
Uncertainties and measurement
- Read Ch 1-9, T.P.A. Hase “Measurements and their Uncertainties” before 24 September 2025.
- A basic introduction to uncertainties and measurements written by Amrozia Shaheen and Sabieh Anwar
- This is a link to a highly useful textbook written by Dr. Louis Bouchard of the University of California, Los Angeles, on “Data, Uncertainty and Error Analysis“. Slightly mathematical but it presents comprehensive coverage of data analysis one may encounter in the experimental physics lab.
- A Jupyter notebook can be found here that we used in class to talk about types of uncertainties, meaning of standard deviation and its difference from standard error, followed by confidence intervals.
- To assist with data analysis, here is an accompanying document that contains a useful formula cheat sheet and sample questions which we in fact tried to solve in class. Don’t forget to browse through the resources on the Lab-1 page.
Workshop practice 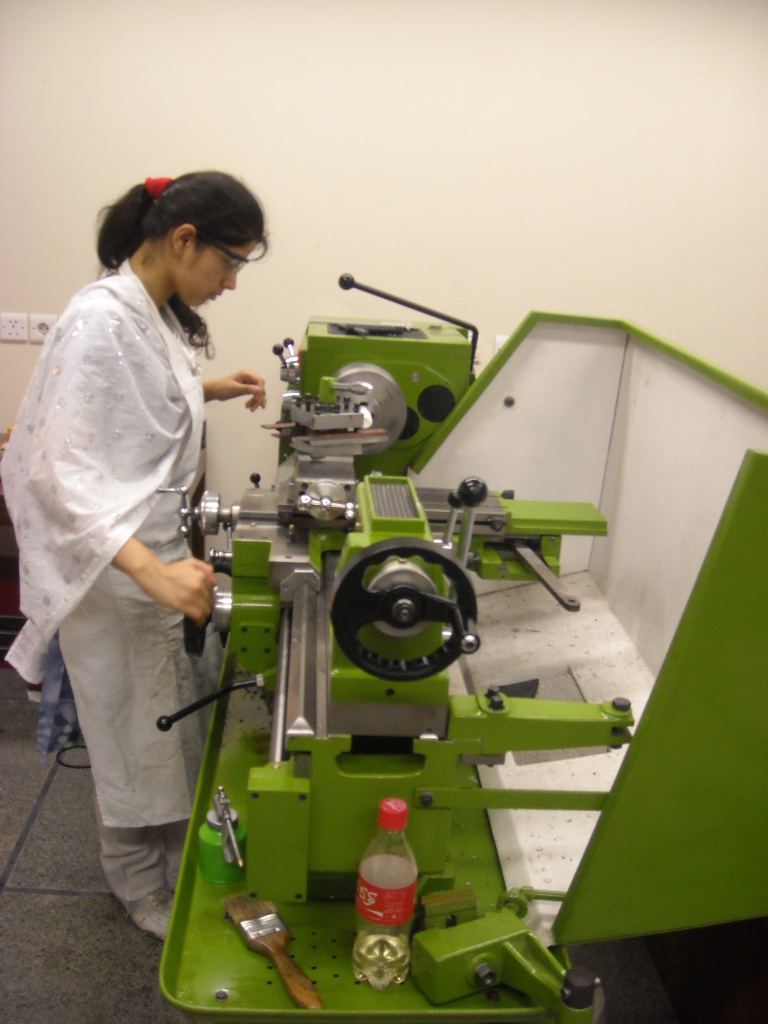
- See the webpage for the mechanical workshop
- Details of the CNC machining centre
- Presentation on the mechanical workshop by Muhammad Rizwan (2016) | Presentation 2018
- Exercise for workshop practice (2016), prepared by Muhammad Rizwan | Exercise on milling, drilling and turning (2018)
- Circuit building exercise: herein students are asked to build a circuit that generates a sawtooth and square wave using a Schmitt trigger. They also learn how to solder.
How to write your lab report
Students are required to type their lab reports in LaTeX. To be able to use LaTeX on your computers, follow the following guidelines, furthermore, read this article on the importance of laboratory notebook by Jacob T. Stanley and H. J. Lewandowski of the University of Colorado,
Please also thoroughly read our Complete Guide to Writing a Report for a Scientific Experiment (PDF). It describes how to prepare a well-articulated lab report that exquisitely narrates the story of an experimenter’s journey throughout the experiment.
(1) Install MiKTeX from the website. MikTeX is a really nice implementation of LaTeX. (2) Install an editor. A free editor is Texniccenter. Another editor that requires a password is Winedt. (3) Try compiling the following sample files. If it works, and a pdf or dvi or ps output is produced, well and good. Use the template for typesetting beautiful documents rich with mathematics, equations and graphics.
All images must be in eps format. For example, figures made in Matlab in .fig format must be saved as *.eps and imported into the LaTeX source code. We normally use Adobe’s Photoshop and Illustrator for the formatting of bitmapped and vector graphics respectively. However, it is also possible to employ a python script to generate your science-savvy plots. Another really useful technique is to employ the Physlab-developed application PhysPlot for creating graphical plots from data.
Also, here is a zipped file which provides you with a nice ready-made template to get started in LaTeX. Finally, here is what I am looking for and not looking for in a lab report. You may also have a look at this sample lab report.