| Researchers | Hafsa Arshad, MS student |
| Time Frame | 2022 to 2023 |
| Description | |
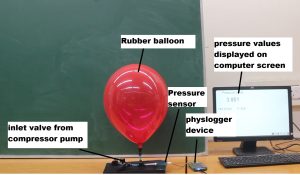
This Master’s thesis presents an experimental examination of rubber balloon behavior during inflation using a completely home-built setup.
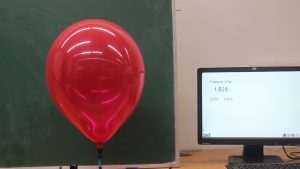
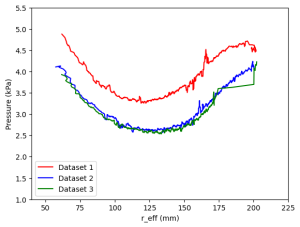
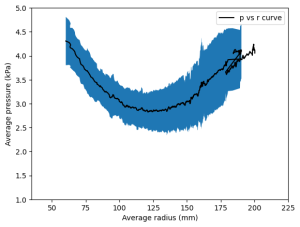
High-speed videos were recorded at 25 fps during inflation. Python libraries for optical character recognition (OCR) and image segmentation were used to obtain pressure-radius curves. The experimental results shown in pressure vs. radius plots clearly express the underlying behavior of rubber balloons under shear stress. The results agreed with the expected theoretical behavior, and the data were further fitted using the Mooney-Rivlin model. The Mooney strain-energy function offers a satisfactory match to data for minor deformations. However, the predictions of this theory significantly differ from observations for large deformations in simple tension and, more generally, in biaxial deformation (deformation in However in some cases, the Ogden strain energy function leading to the three-term Ogden equation has better explained the large deformation behavior of rubber balloons. We discovered that the rubber balloon loses elasticity the more times it is inflated from the cyclic data. The balloon’s rubber stretched after the initial total inflation and increased in size. The inflation pressure to inflate the balloon a second time was lower than the first time, and the same is true for all subsequent cyclic attempts. The digital sensors and experimental techniques we used to extract radius and pressure data to get plots have limitations. In the initial experimental attempt, we used our displacement sensor—Physdisp to obtain radius data and Physbar to retain pressure values, keeping the pressure-radius values coordinated over time. We Therefore, in order to overcome this limitation, in the subsequent experiment, we used optical character recognition to extract pressure data and threshold image segmentation to determine a balloon’s area and volume using the solid revolution formula. This eventually determined the balloon’s effective radius. Furthermore, in planning this endeavor, we wanted to identify the radius and sync it with pressure data obtained from the physbar. The concept of the image processing method allowed us to create contours after marking the balloon’s region of interest to extract the radius from the image. Then, we considered synchronizing the radius and pressure measurements. The rationale
The study concludes that the home-built setup, including the sensors and data extraction techniques, is a viable investigation of rubber balloons. Additionally, further experimentation with balloons could lead to a better understanding of the system’s state equation, including state variables such as entropy, pressure, and internal energy. | |


