| Student Manual, Student Manual | A thermistor is a semiconductor used to measure temperature. Its resistance depends on the temperature. The goal of the present experiment is to determine the resistance R as a function of temperature T. You are expected to come up with a mathematical model that can predict the temperature from the measured resistance. |
| Software Code | CSV file containing time, resistance and temperatureHere is a Jupyter notebook that showcases some sample calculations on fitting thermistor and thermocouple data to the Steinhart-Hart equation Another Jupyter notebook that shows how to use nonlinear fitting to generate the model of the thermistor |
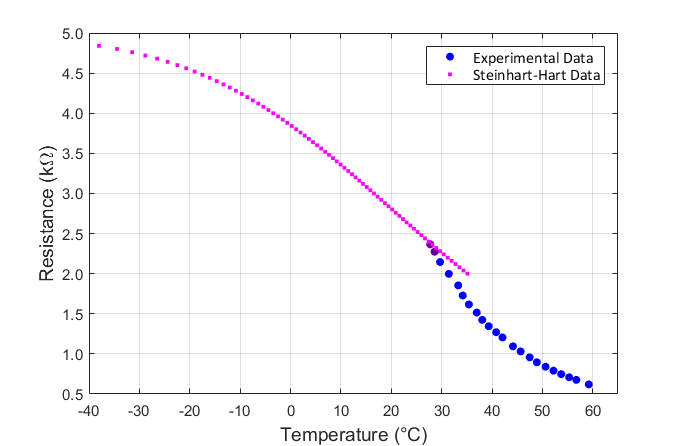
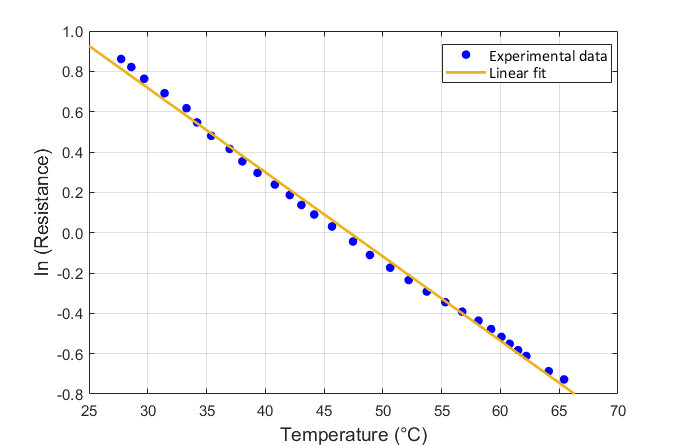
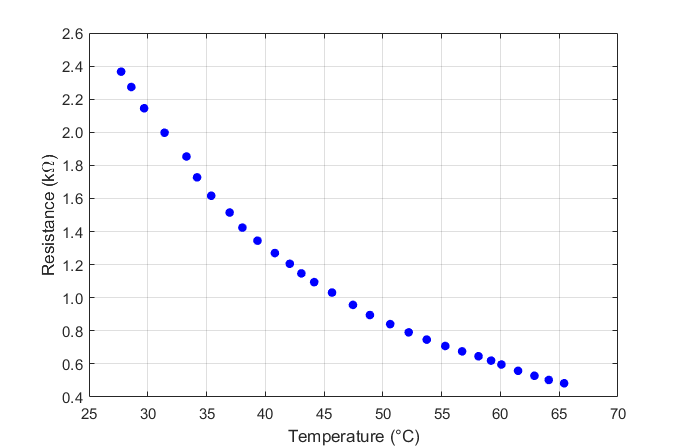
| Sample Results | Steinhart curve fit to the experimental dataResistance vs. Temperature experimental dataResistance vs. Temperature linearized semi log plotSample data from December 2025 |
| Hardware Manual | Application Note: PhysLogger and Thermistor |
| Experiment Code | 1.3A |
| Version | 6 January 2026, 2026-v1 |
Further Readings and References
- Constructing a model from data (the thermistor example)Qosain Scientific,http://www.qosainscientific.com, Faisal Saeed and Muhammad Sabieh Anwar, (2026).
Pictorial Procedure
-
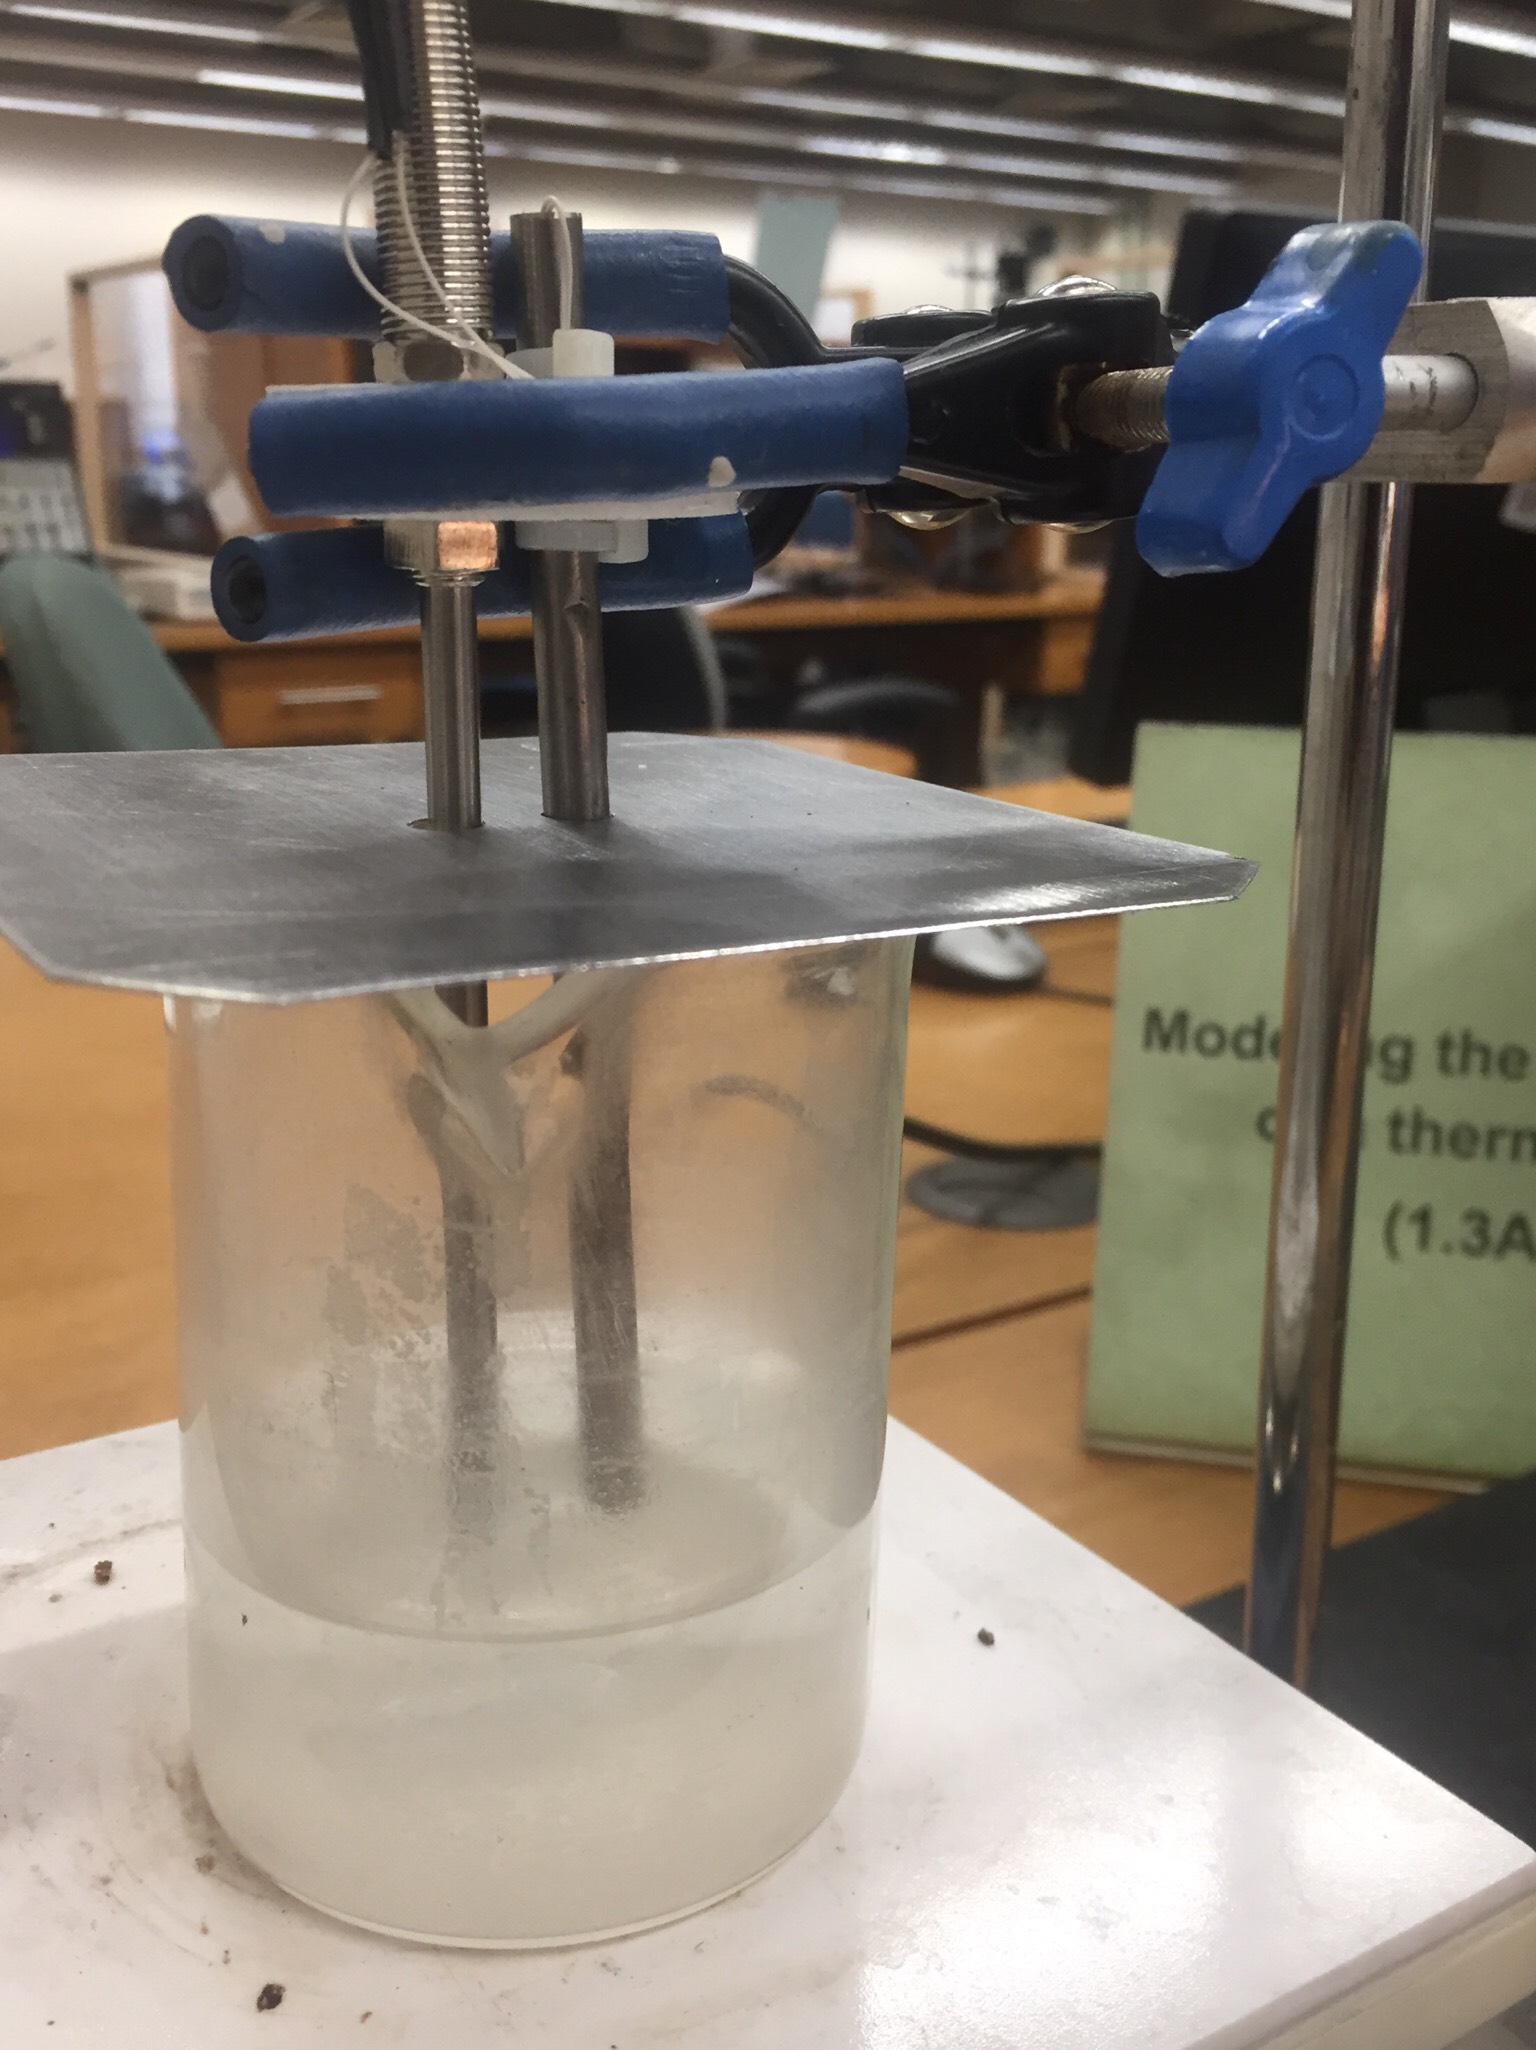
- The complete apparatus
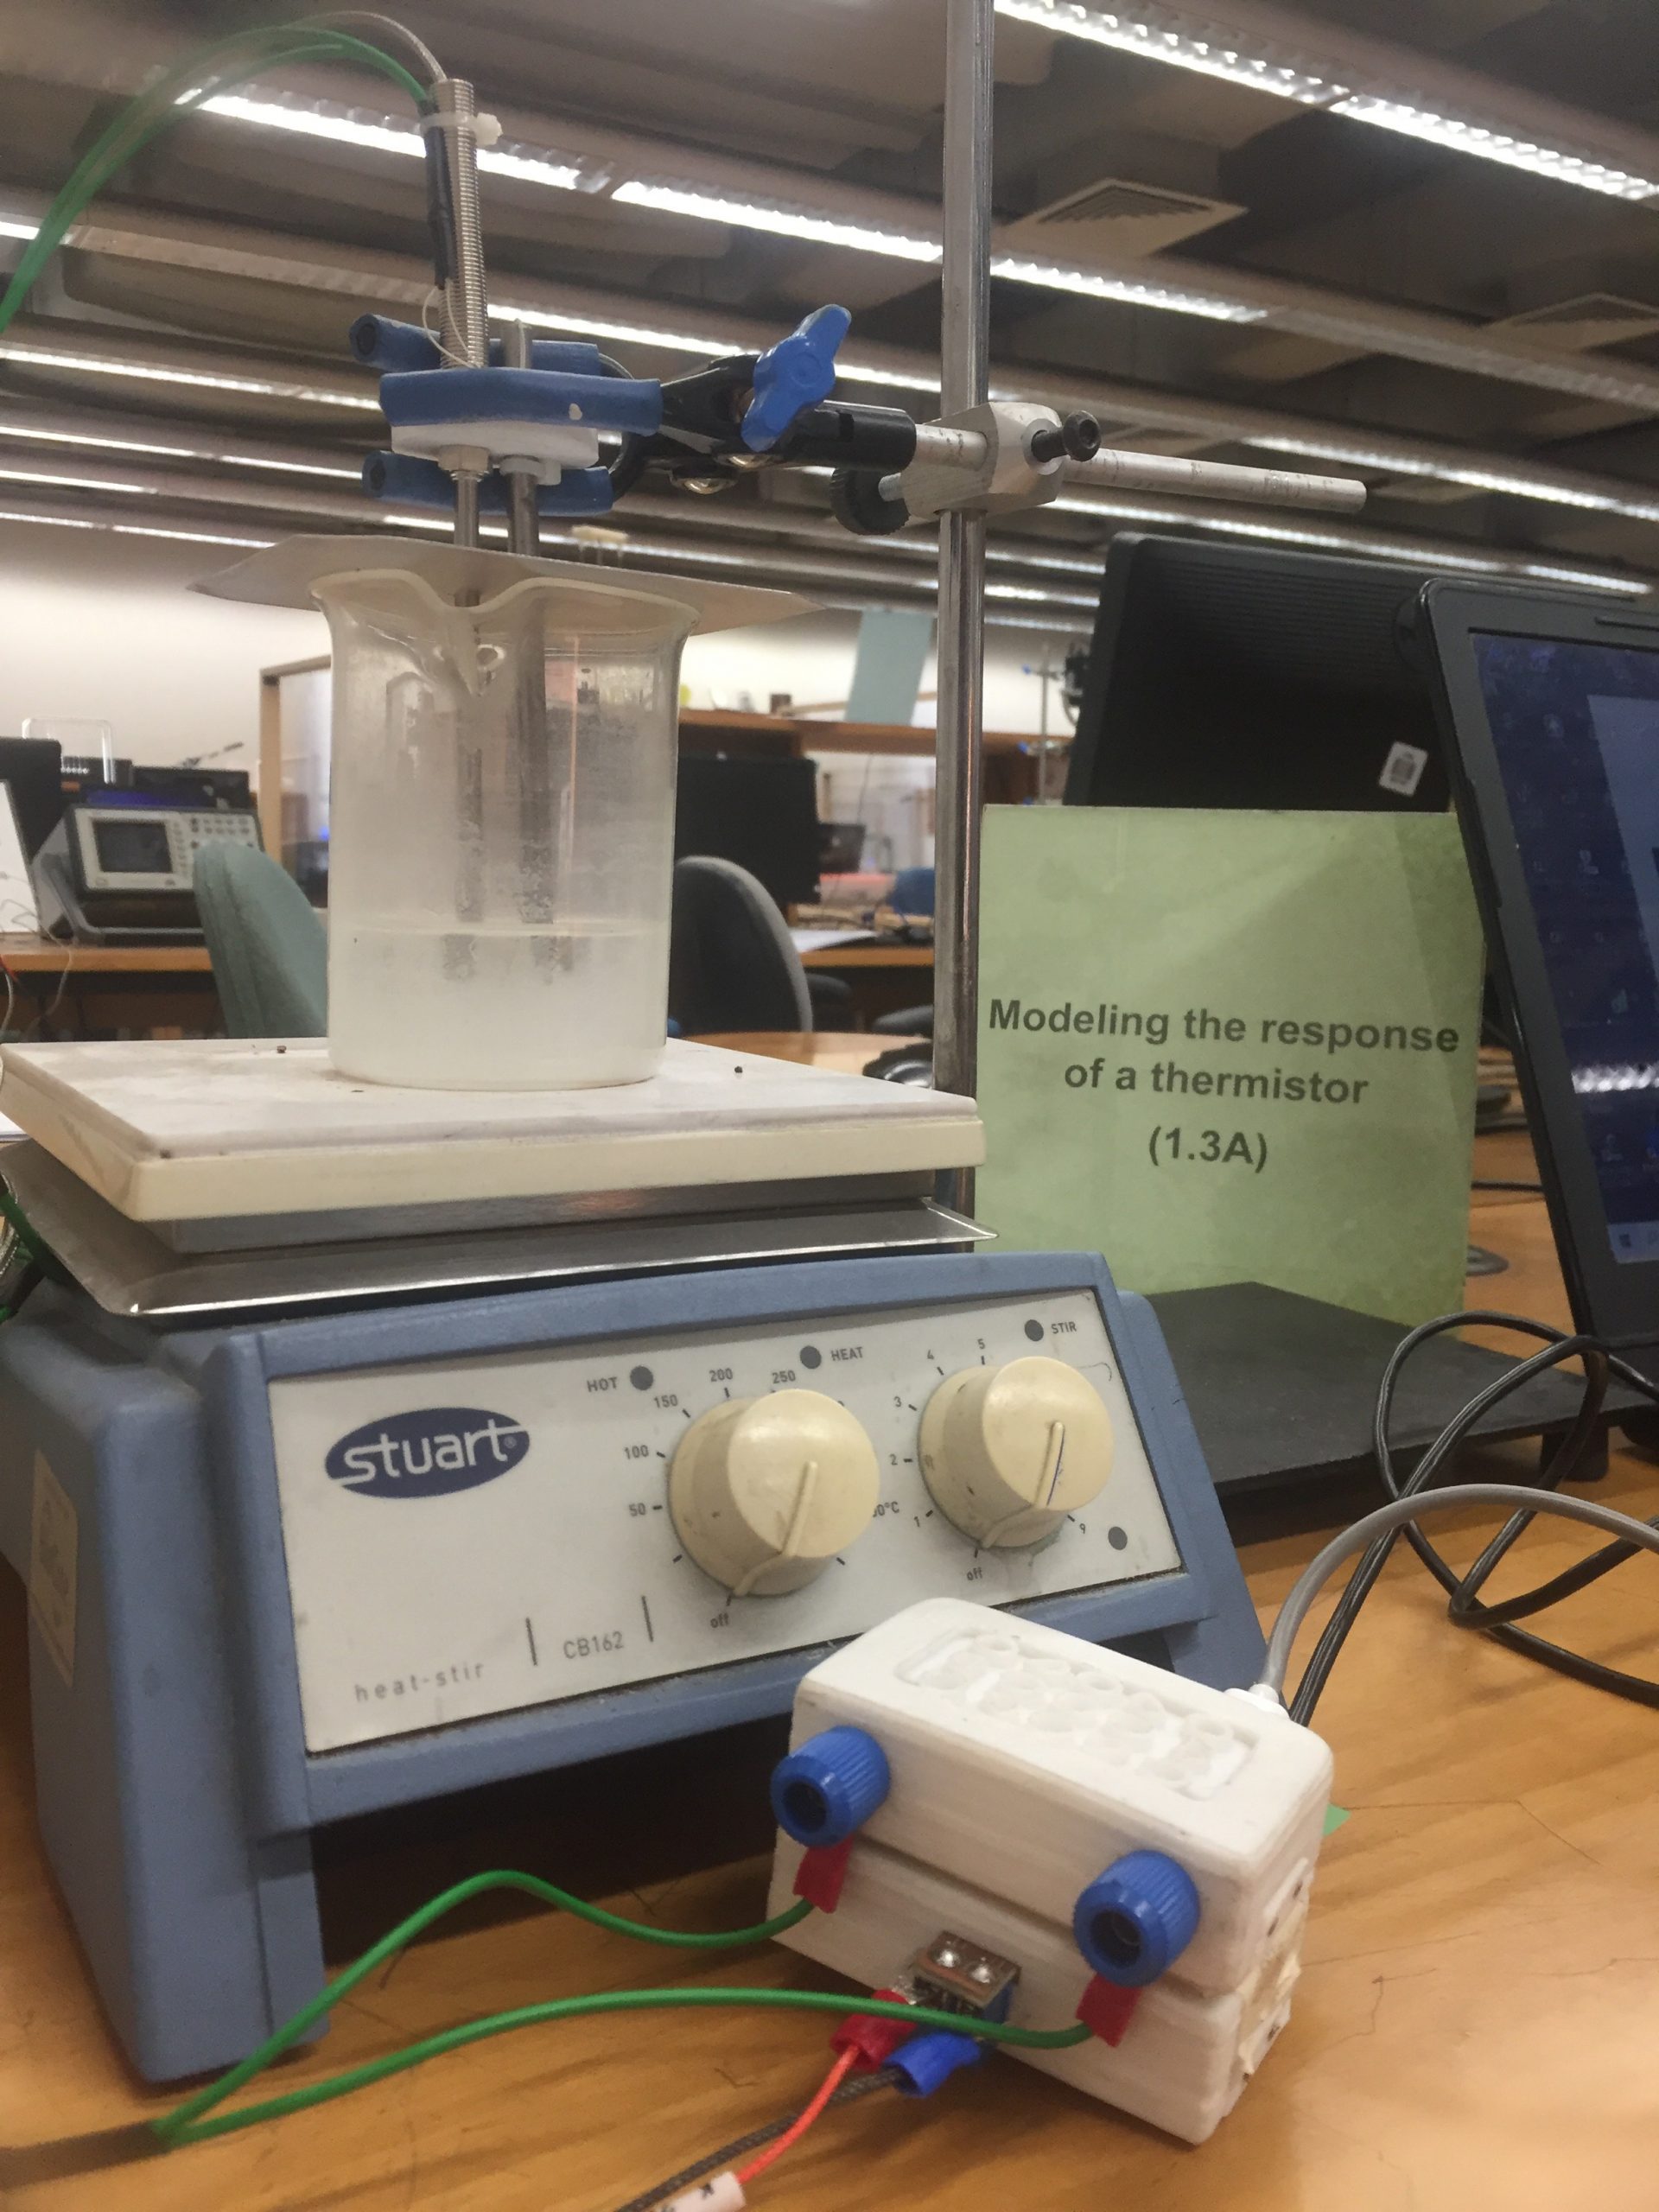
-
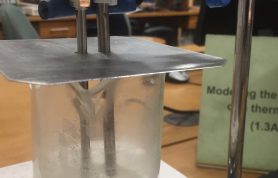
- A closeup of the thermometer and thermistor containing beaker
-
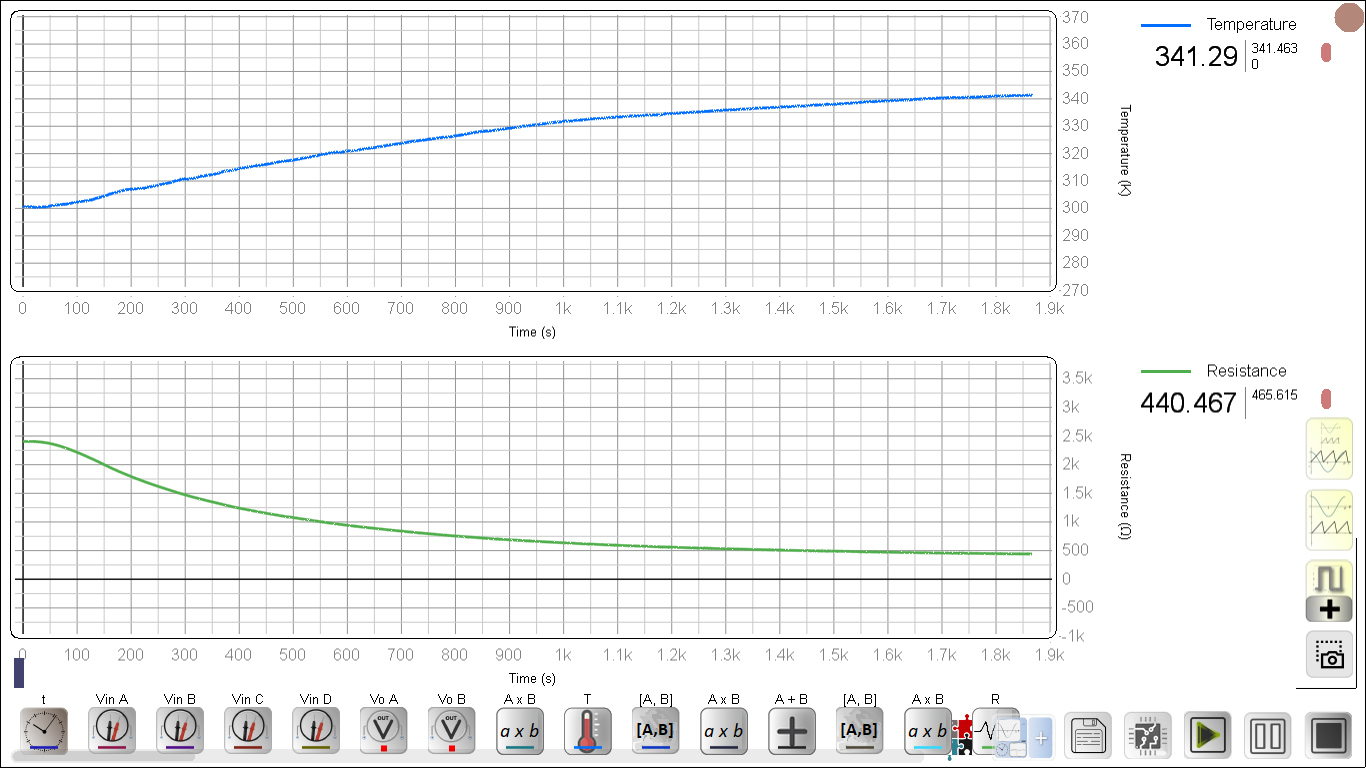
- Physlogger screenshot during data collection
-
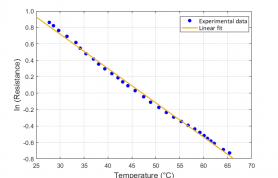
- Linearized Resistance Vs. Temperature plot
-
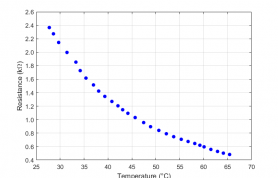
- Experimental Resistance Vs. Temperature plot
-
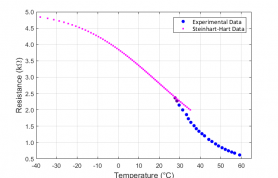
- Steinhart curve fitting to the experimental data