| Student Manual |  This is a veiled introduction to data acquisition. Furthermore, students will be exposed to the ideas of filtering, noise, sampling and autocorrelation.Students will be required to analyze the autocorrelation of the noise signal, generated from a pseudorandom binary signal. This will be followed by low-pass filtering using a simple RC circuit and calculating the autocorrelation of the filtered signal. |
| Software Code | codes |
| Sample Results | Gain of a low pass filter as a function of frequencyCircuit for pseudo-random noise generation based on shift registers |
| Experiment Code | 1.6 |
| Version | 1st October 2008 |
Further Readings and References
- Signal enhancement in the presence of high noise levels: the electrocardiogramThe Physics Teacher, A. Thompson and A. Trolestra, 34, 418, (1996).
- Noise reduction by signal accumulationThe Physics Teacher, Y. Kraftmakher, 44, 528, (2006).
- Autocorrelation of electrical noise: an undergraduate experimentAmerican Journal of Physics, J.L Passmore, B.C. Collings, P.J. Collings, 63, 592, (1995).
- A course in computer based data acquisitionAmerican Journal of Physics, W.N. Hubin, 70, 80, (2002).
- Two student experiments on electrical fluctuationsAmerican Journal of Physics, Y. Kraftmakher, 63, 932, (1995).
Pictorial Procedure
|
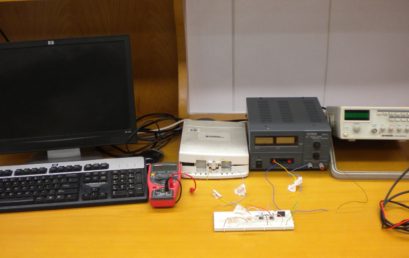
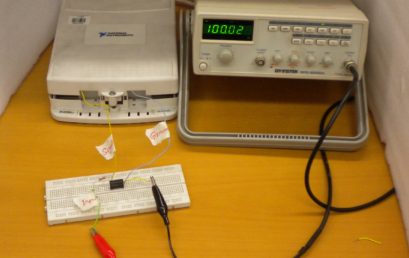
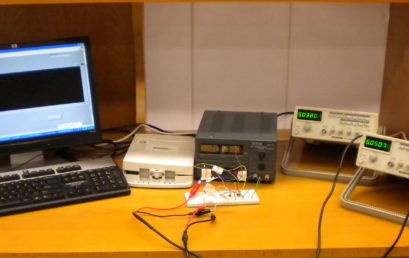
1. Provided apparatus |
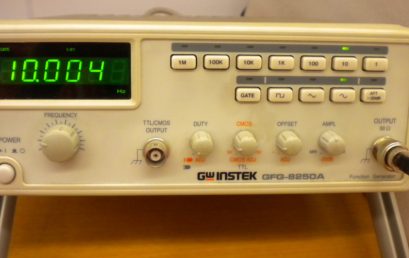 2. Generating a sine wave of 10 Hz with signal generator |
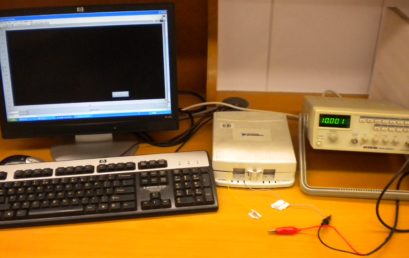 4. Setup for Nyquist Sampling Theorem |
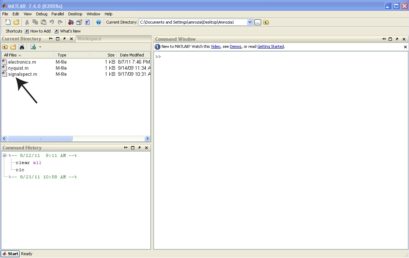 5. All function files must be in the current directory of Matlab |
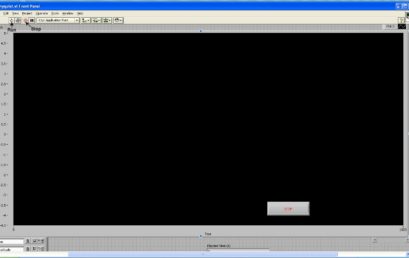 6. Front panel view of nyquist.vi file |
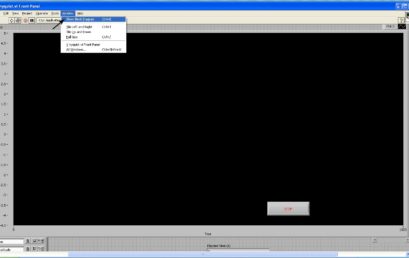 7. Accessing block diagram window |
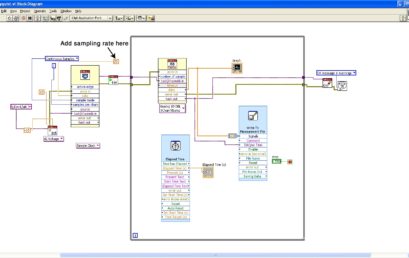 8. Changing sample rate in the Block diagram window |
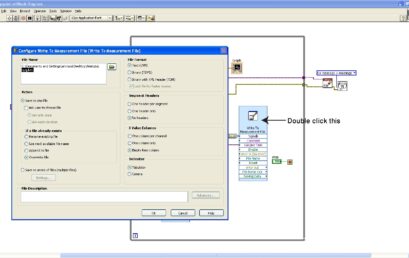 9. Saving data in nyq.lvm file. You can change the folder path as well |
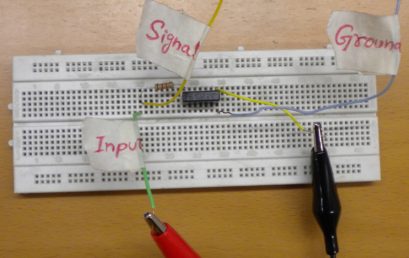
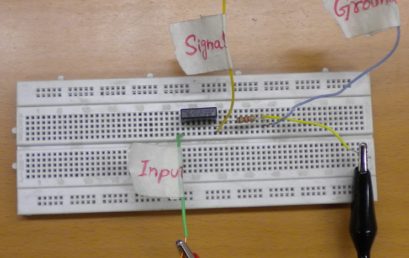
 10. Circuitry for low pass filter |
 11. In order to change the input peak voltage to 5V, you need to use this configuration |
 12. High pass filter with 1.3KHz cut-off frequency |
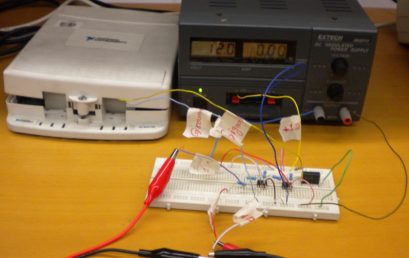 13. Circuitry for composite signal |
 14. Setup for filtering a composite signal |