| Student Manual |  In this experiment students work with radioactive sources and radiation detection apparatus. They perform quantitative measurements of the properties of these sources. They also statistically analyze the distribution of the different kinds of the particles, corelating the trend with the Poisson and Normal distributions. |
| Software Code | Geiger Counter Matlab Utility |
| Sample Results | Experimentally achieved histogram overlaid with the Poisson distribution for the gamma source |
| Experiment Code | 1.10 |
| Version | 3rd November 2015,2015-v3 |
Further Readings and References
- RadioactivityModern physics, Thomson Learning, Inc., Serway, Mosses and Moyer, 479, (2005).
- Example taken from Boas’s bookMathematical methods in the physical sciences, M. L. Boas, 729, .
- RadioactivityIntermediate atomic and nuclear physics, St. Martin's Press. New York, A. W. Harrison, 116, (1966).
- Radioactive decayConcepts of Modern Physics, McGraw-Hill companies, Arthur Beiser, 419, (2003).
- About the Poisson DistributionStatistics methods and applications, Dr. M. Afza Beg, 198, .
Pictorial Procedure
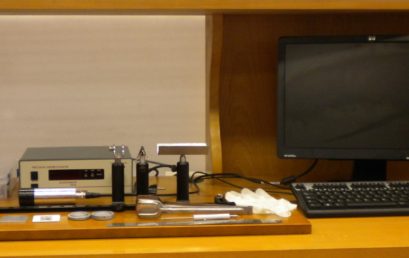
1. Provided apparatus
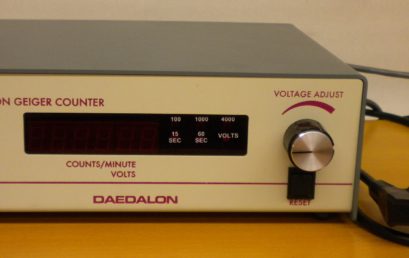
2. GM Counter
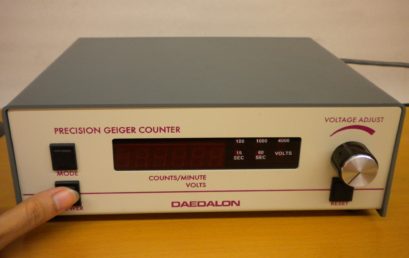
3. Connect power cable to the AC mains, turn VOLTAGE ADJUST knob anti-clockwise and press POWER button
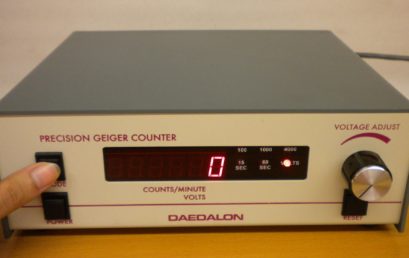
4. Press VOLTS button 6 times till LED behind blinks
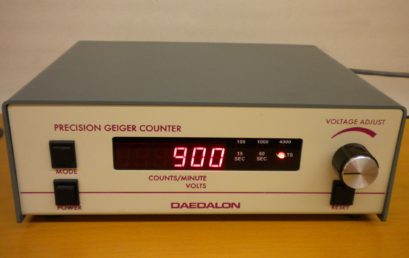
5. Set 900V through VOLTAGE ADJUST knob
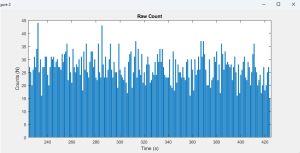
6. Bar graph of the raw counts ın the Matlab utility
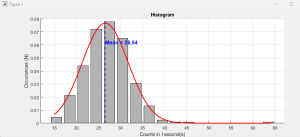
7. Histogram of the counts
8. Mounting a source holder
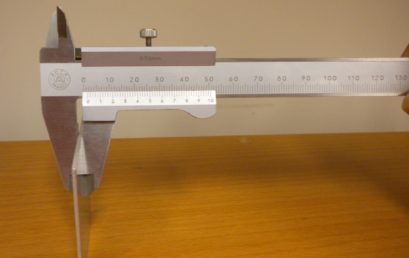
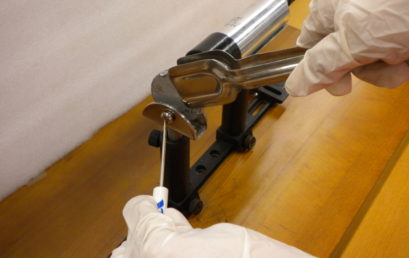
9. Measuring the thickness of an absorbing sheet
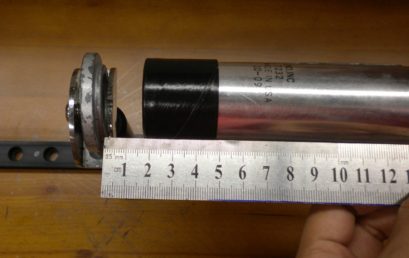
10. Measure the distance (d) between source and GM tube
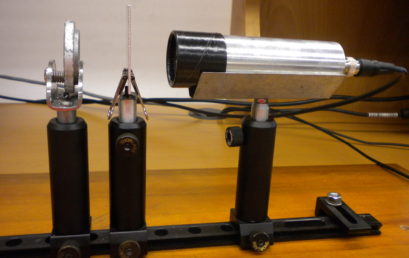
11. Placing an absorbing sheet between the source and detector